Data Conversion in Radar Chart
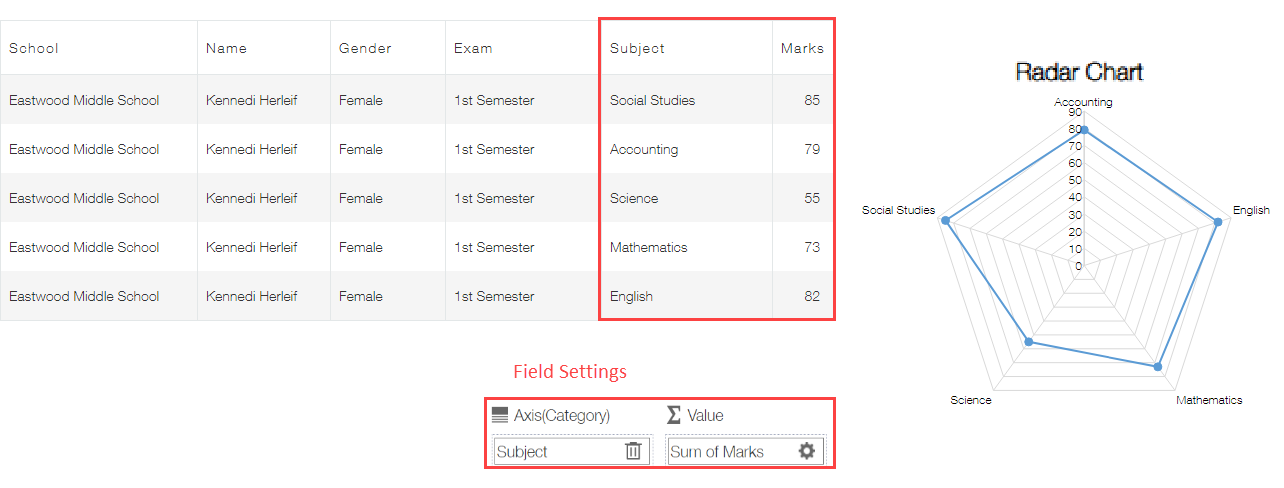
krewDashboard usually creates radar charts by grouping each item of the field assigned to the axis (item) and aggregating the value field.
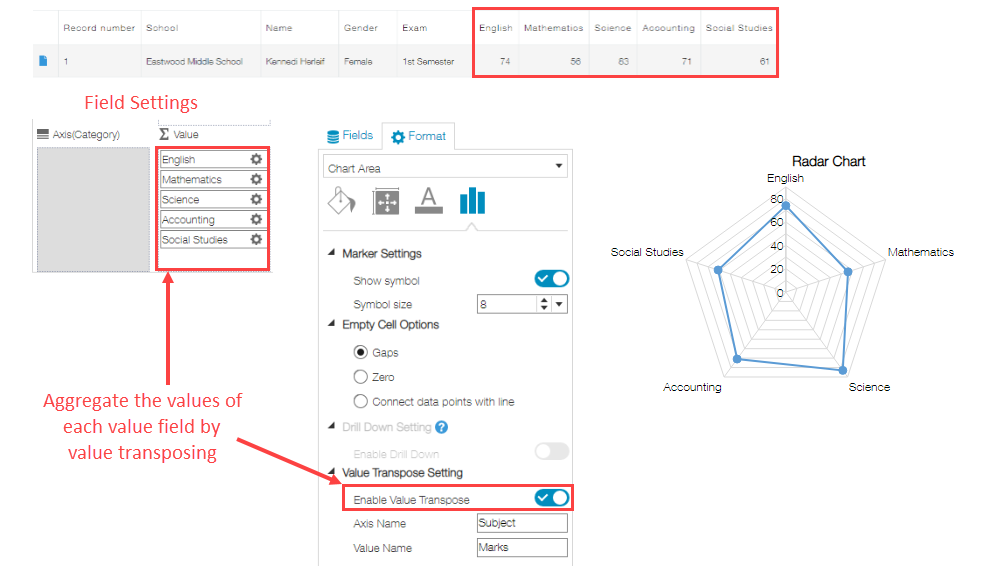
You can also create a radar chart from the source data app illustrated below by enabling the Enable Value Transpose option.
You can set the data conversion for radar chart by checking Enable Value Transpose in the Format area.
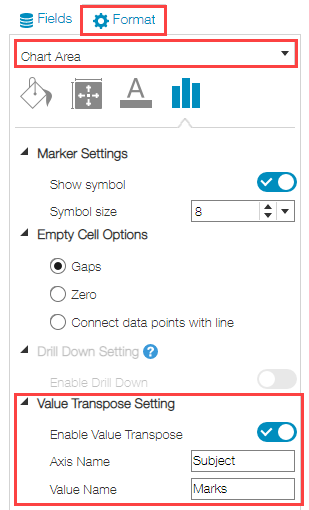
You can set the following items.
| Item |
Remarks |
| Enable Value Transpose |
|
| Axis Name |
The name you set will be used in the following cases:
- Tooltip
- Conditional formatting
- Sort
- Custom List
- Export
|
| Value Name |
The name you set will be used in the following cases:
- Tooltip
- Conditional formatting
- Sort
- Export
- Reference Line
|