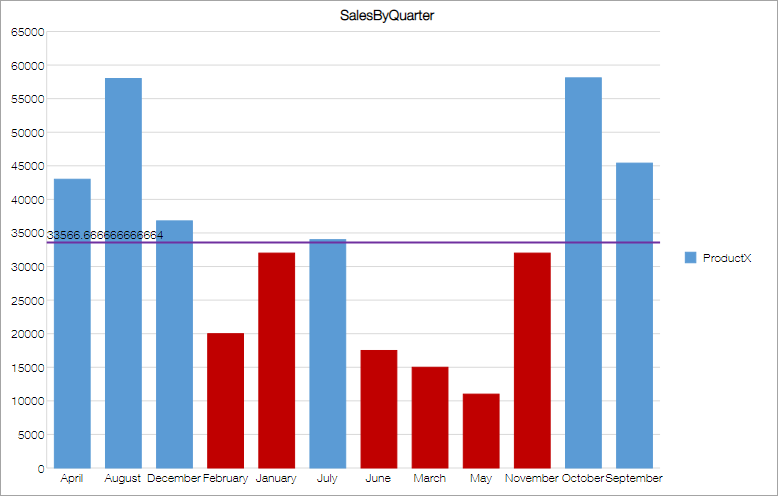
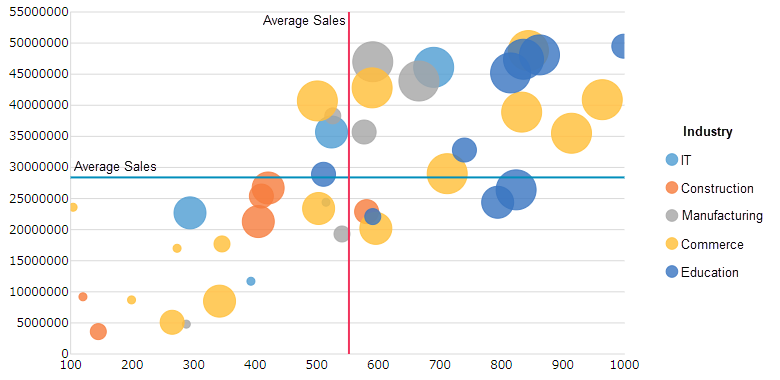
By using reference line feature of krewDashboard, you can draw a line at a fixed value such as upper limit or at a calculated value such as average or maximum value.
Set Reference Line
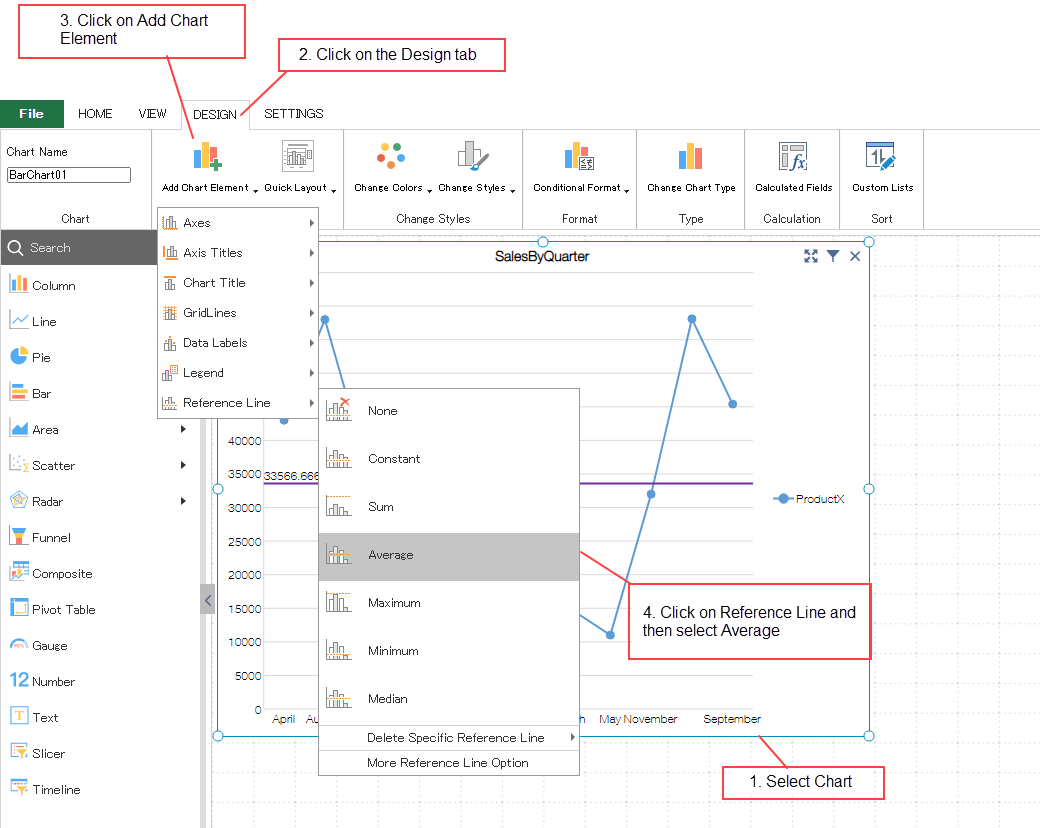
You can add a reference line by using Add Chart Element in the Design tab of ribbon area. You can add multiple reference lines.
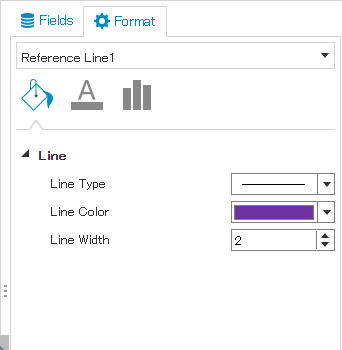
Once added, you can style reference line in the Format area on right side.
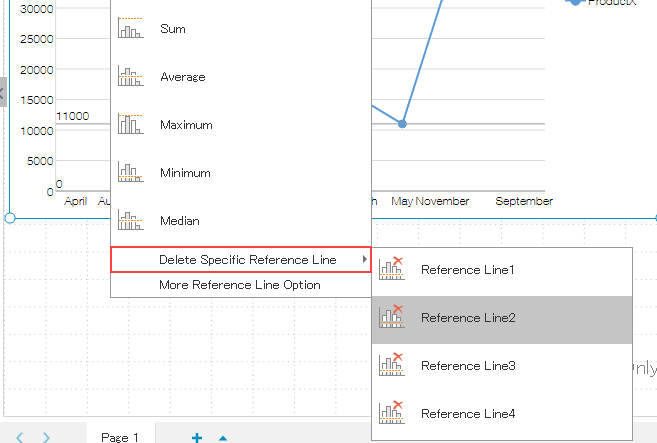
To delete the added reference line, select the reference line to be deleted from Add Chart Element > Reference Line > Delete Specific Reference Line. All reference lines are deleted on selecting Reference Line > None.
You can set following items of a reference line.
| Category | Item | Remarks |
|---|---|---|
| Line | Line Type | Select from solid, dashed or dotted lines |
| Line Color | ||
| Line Width | ||
| Text Fill | Color | Select the color of label text |
| Text Font | Font Size | |
| Text Editor | Label | None: No label Custom: Display custom text Value: Display a value Custom and Value: Display text and value |
| Custom Text | Enter the text required in case of Custom or Custom and Value in label. | |
| Reference Line | Name | Name to identify on the Plug-in Settings page of krewDashboard. |
| Type | Choose from Constant(specified value), Sum(total of all values), Average, Maximum, Minimum and Median | |
| Axis Type | In case of constant, specify on which axis the reference line should be drawn in following chart types Scatter/Bubble chart: Select from X-axis or Y-axis Composite chart: Select from Primary Axis or Secondary Axis | |
| Value | Specify the constant value | |
| Value Field | Select the value field to be used in the case of aggregates, that is, Sum, Average, Maximum, Minimum and Median | |
| Number | Format | Display format of value label |
| Label Position | Position | Specify the position of label |
The reference lines that can be used for each chart type are as follows. Numbers, gauges and pivot tables do not support this feature.
| Chart Type | Constant | Sum | Average | Maximum | Minimum | Median |
|---|---|---|---|---|---|---|
| Column | 〇 | 〇 | 〇 | 〇 | 〇 | 〇 |
| Stacked Column | 〇 | - | - | - | - | - |
| 100% Stacked Column | 〇 | - | - | - | - | - |
| Line | 〇 | 〇 | 〇 | 〇 | 〇 | 〇 |
| Stacked Line | 〇 | - | - | - | - | - |
| 100% Stacked Line | 〇 | - | - | - | - | - |
| Pie | - | - | - | - | - | - |
| Doughnut | - | - | - | - | - | - |
| Bar | 〇 | 〇 | 〇 | 〇 | 〇 | 〇 |
| Stacked Bar | 〇 | - | - | - | - | - |
| 100% Stacked Bar | 〇 | - | - | - | - | - |
| Area | 〇 | 〇 | 〇 | 〇 | 〇 | 〇 |
| Stacked Area | 〇 | - | - | - | - | - |
| 100% Stacked Area | 〇 | - | - | - | - | - |
| Scatter | 〇 | 〇 | 〇 | 〇 | 〇 | 〇 |
| Bubble | 〇 | 〇 | 〇 | 〇 | 〇 | 〇 |
| Radar | 〇 | 〇 | 〇 | 〇 | 〇 | 〇 |
| Filled Radar | 〇 | 〇 | 〇 | 〇 | 〇 | 〇 |
| Funnel | 〇 | - | - | - | - | - |