In This Topic
Flow of krewDashboard Feature Settings
This topic discusses the flow of feature settings on the krewDashboard Plug-in Settings page.
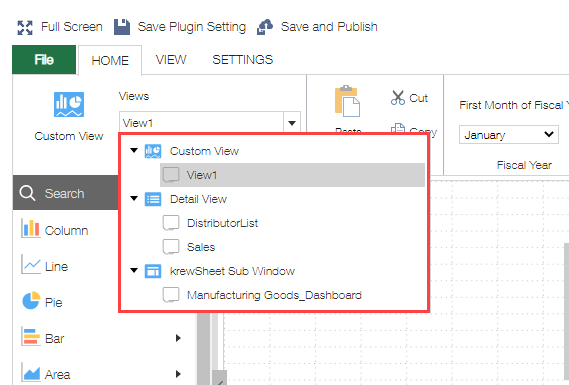
- Select a view
You can select the view, space field and sub window in the Views drop down in ribbon area.
※The view displayed in "Custom View" is the customized display format, the space field displayed in the "Detail View" is only the space field for which the element ID is set, and the sub windows displayed in the "krewSheet sub window" are only sub windows set to "Show krewDashboard" in the sub window setting dialog. You can select a view, space field, or krewSheet sub window within the same app.
- Create dashboard.
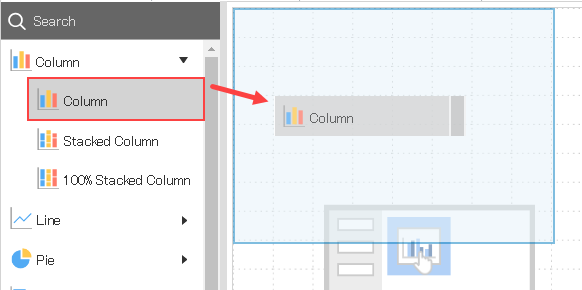
- Select a chart
Drag and drop a chart from chart panel.
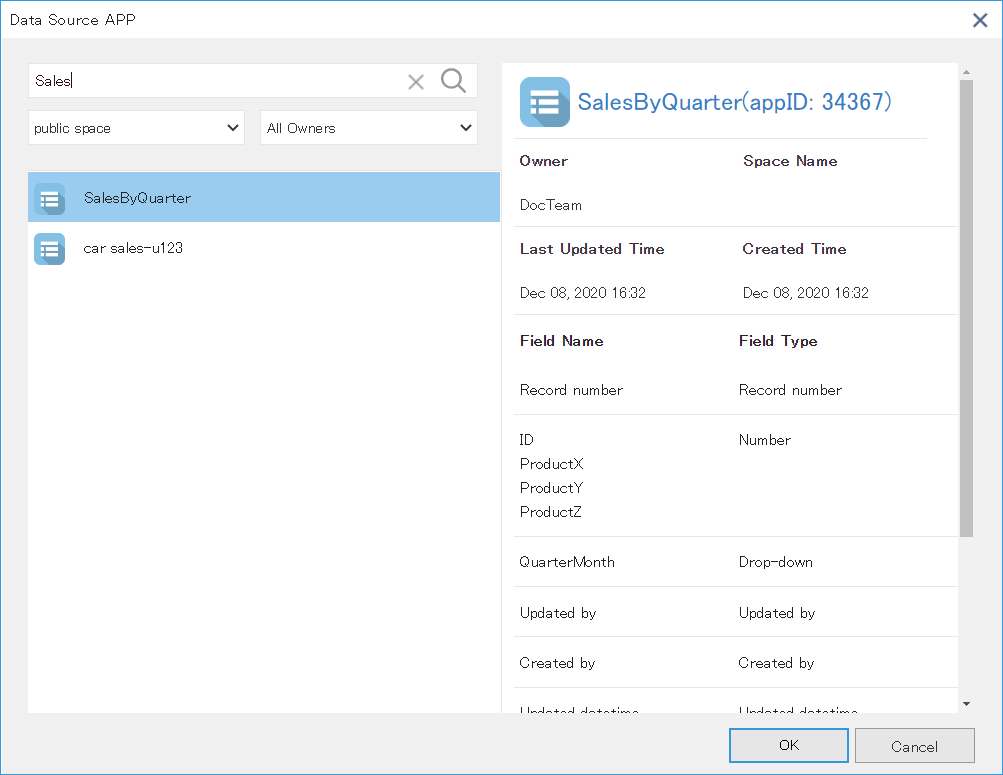
- Select an app
Select the target app.
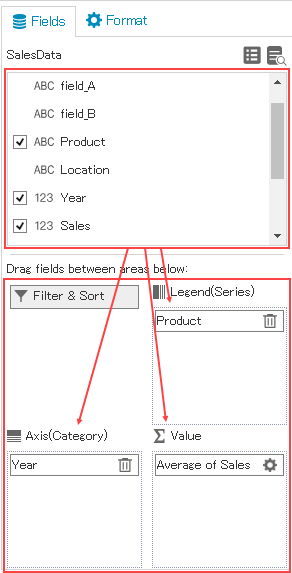
- Select fields
Drag and drop the data fields you want to visualize.
- Feature Settings
For detailed description about feature settings, see the sub-topics.
- Save the settings and update the app
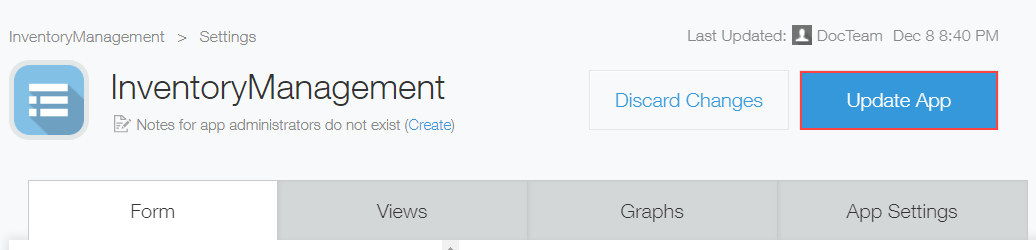
Click Update App to save the krewDashboard settings and overall app settings, and run the app.
Settings Page
This section discusses the details of settings page of krewDashboard.
| Setting |
Description |
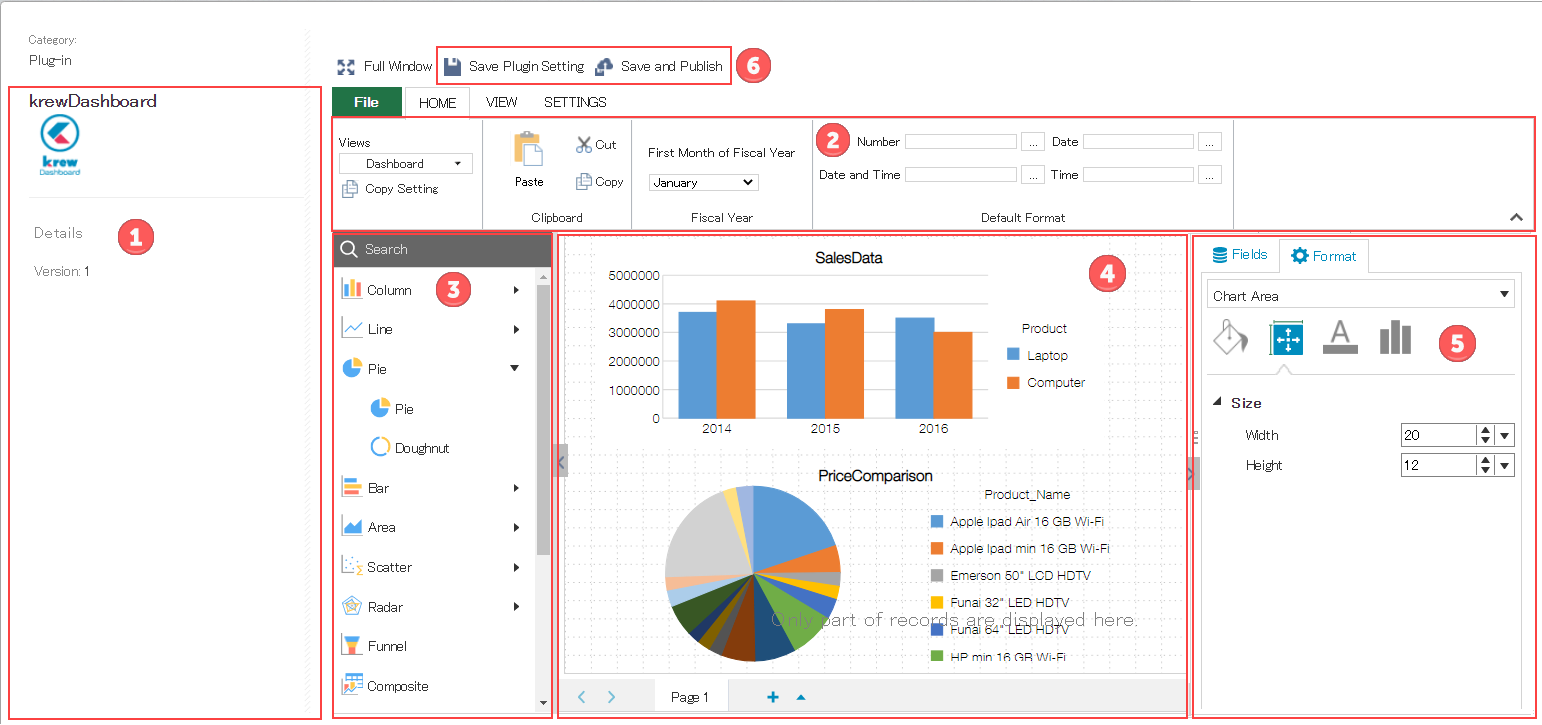
| 1 |
Plug-in information area. |
| 2 |
Ribbon area. Menus of various features. |
| 3 |
Chart panel that displays a list of chart types, pivot table and text to be placed in the page area. |
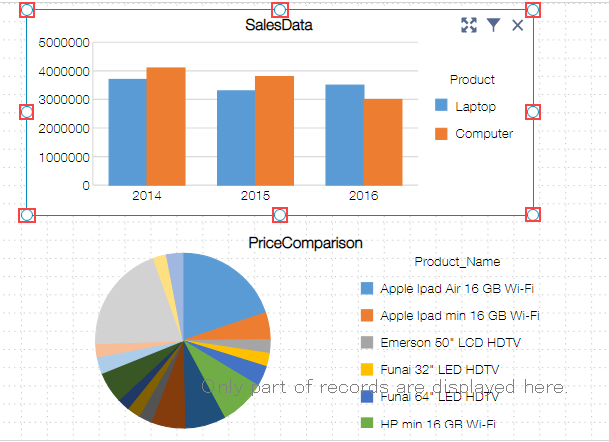
| 4 |
Page area. Drag and drop the charts to be displayed from the chart panel to the page area. You can move the chart by dragging and resize it using handles placed on corners and middle of the chart frame.
|
| 5 |
Fields/Format area. In Fields tab, you can set how to aggregate the app data. In the Format tab, you can customize display format of the chart. For more details about the settings, see the topics below.
|
| 6 |
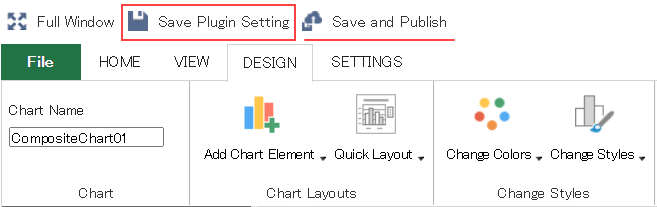
Click Save Plugin Setting button to save the krewDashboard settings done on this page.
On clicking the Update App button, changes done in the app are also saved along with the krewDashboard settings done on this page. This operation is same as that of Update App button of the App Settings tab.
 |
On the Plug-in Settings page, chart is created using maximum of 500 data records.
Ribbon Menus
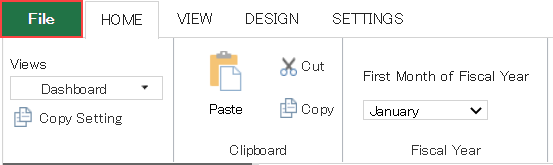
Home
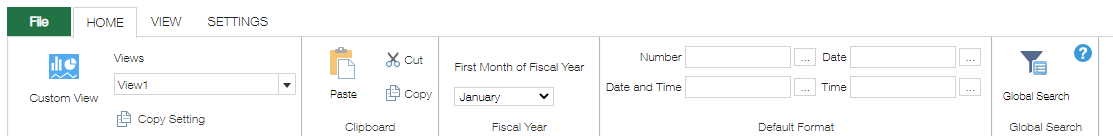
- Reuse the Settings by copying them.
- Reuse the settings by copying the individual charts, pivot tables and text.
- Set first month of the fiscal year.
- Set the standard format. For detailed information about formatting, see the topic below.
- Set the global search. For detailed information about global search, see the topic below.
View
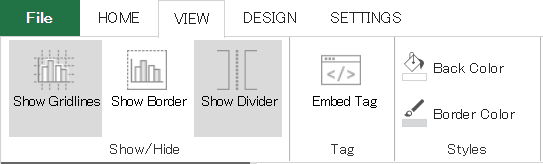
- On settings page, specify whether to display the gridlines in page area.
- Set whether to display the chart border.
- Specify whether to add blank space between charts.
- Get the tag for embedding the dashboard. (It is a feature similar to Retrieving Embed Tags for Summarized Results of kintone chart)
- If krewDashboard is being displayed on the detail view or krewSheet sub window, it cannot be used.
- Specify back color of the page.
- Specify border color of the chart.
Design
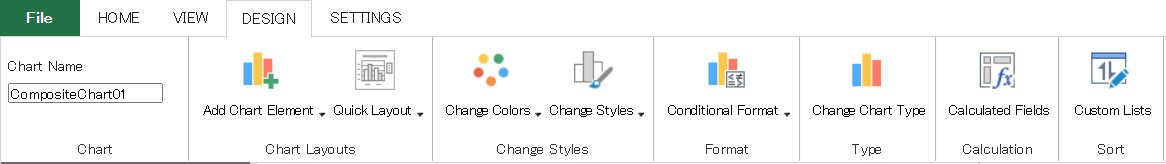
- Set design of chart or pivot table.
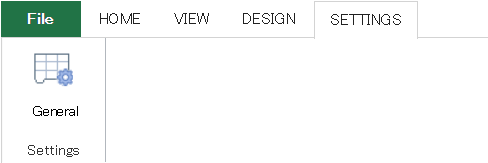
Settings
File
See Also