In This Topic
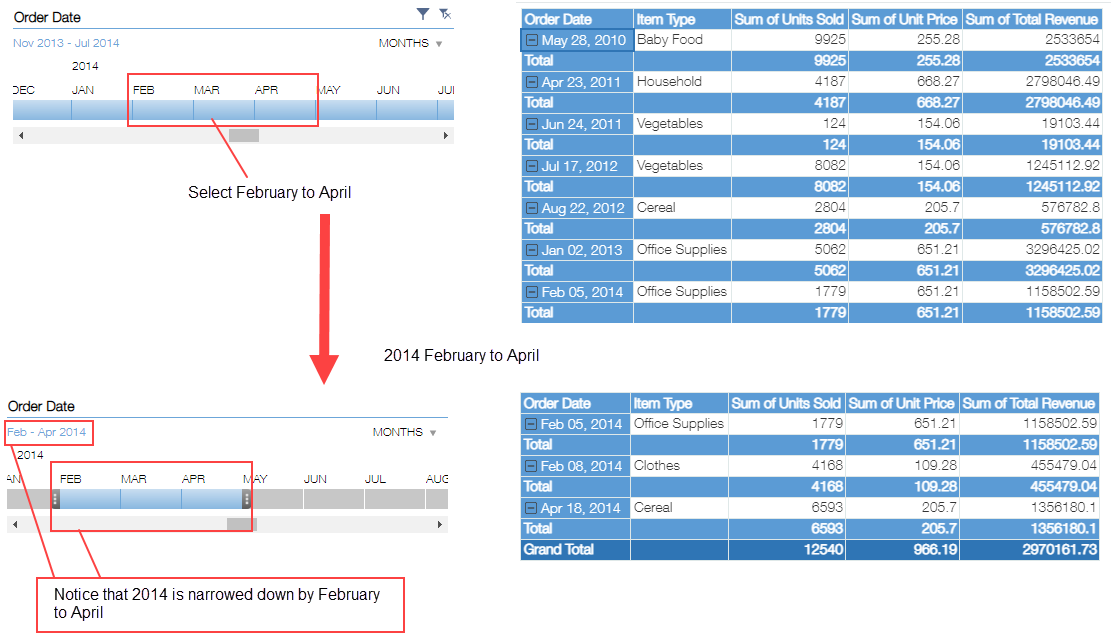
Timeline lets you filter the data to be aggregated and also lets you know the filtering criteria at a glance. It is used for filtering charts or pivot tables that use the same data app. Functionality of timeline is similar to slicer, except for the fact that timeline is used for filtering the aggregation period of dates.
Below are the steps to create a Timeline.
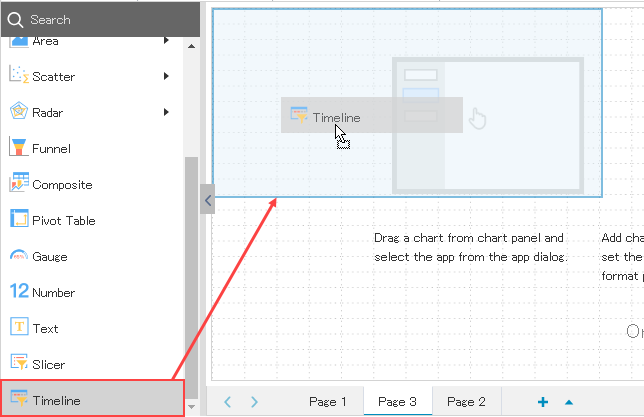
- Drag and drop a Timeline from the chart panel on left to the page area.
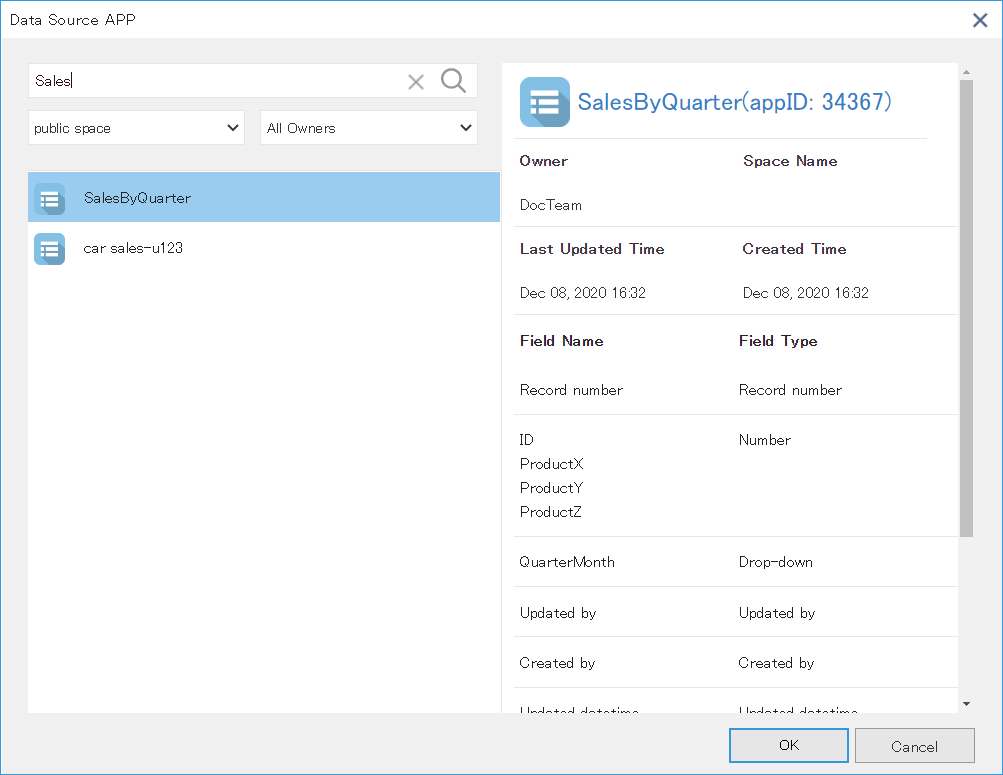
- In the Data Source App dialog, select an app to be used in Timeline.
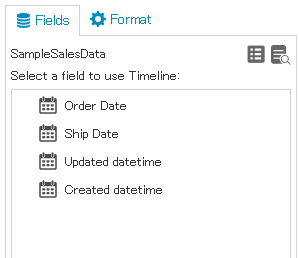
Selected app can be changed by using the app selection icon in the Fields area.
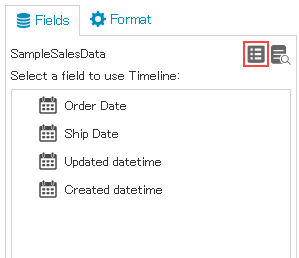
- Select a field for specifying the extraction condition from the Fields area on right.
- Drag and drop a chart from the chart panel on left to the page area.
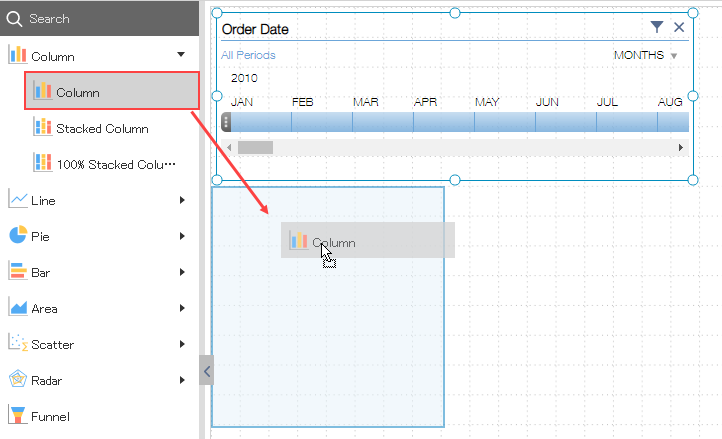
- In the Data Source App dialog, select the app you selected for Timeline.
※Timeline is used for filtering charts or pivot tables that use the same data app.
Timeline Settings
Timeline Settings
You can configure elements of the created Timeline. Below section discusses the elements displayed on the Timeline and how to configure them.
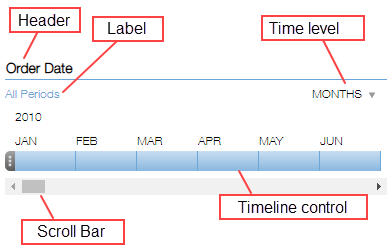
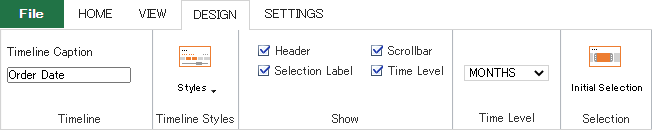
You can set the header text using Timeline Caption field of the Design tab in ribbon area. To switch the display of each element of the Timeline, you can use various checkboxes given in the ribbon area. You can also choose initial Time Level to be displayed from "Years", "Quarters", "Months" and "Days".
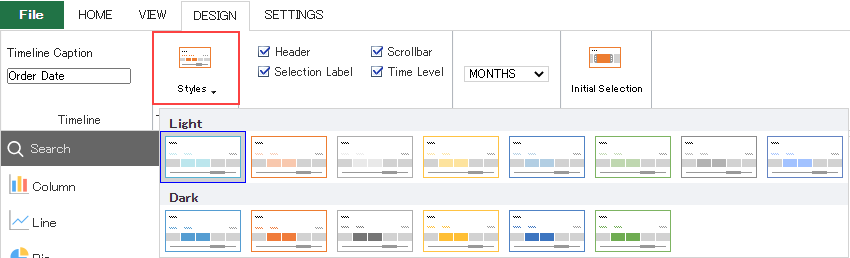
Change the Timeline Design
You can choose one of the 14 designs from Styles option in ribbon area.
Set Initial Selection Range
You can set a range of dates that should be selected in the Timeline at the time of initial display.
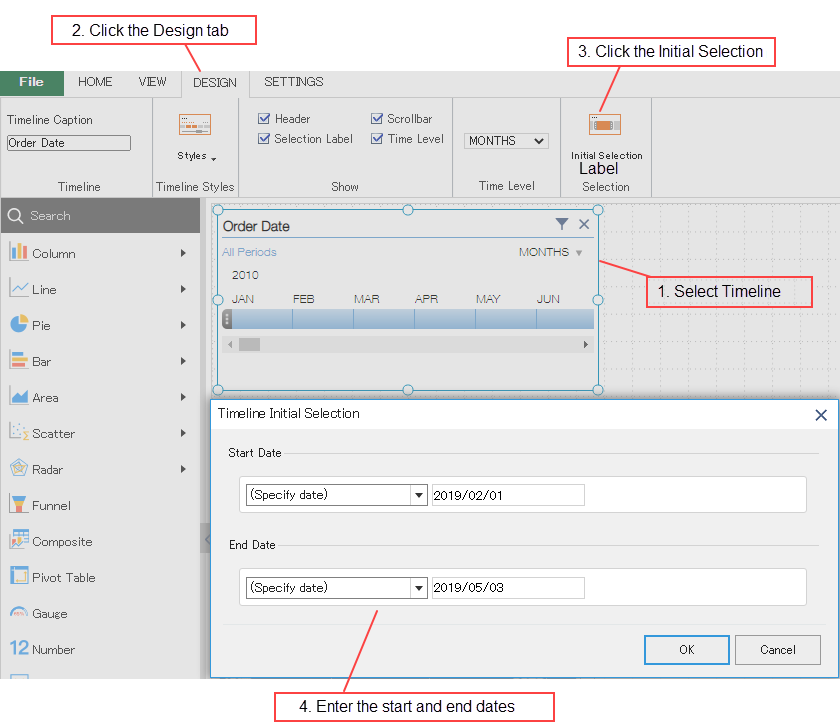
Below is an example of setting the selection range.
| Selection Range |
Start Date |
End Date |
| February - May 2019 |
(Specify date) 2019/02/01 |
(Specify date) 2019/05/31 |
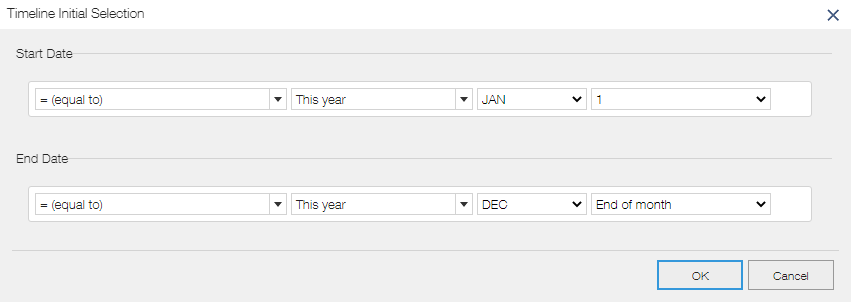
| January - June this year |
This year, Jan, 1 |
This year, Jan, End of month |
| This month |
This month, 1 |
This month, End of month |
When krewDashboard is displayed on the kintone's record detail screen or krewSheet sub window, you can also use the field values of the displayed record as conditions in the same way as Filter using Record's Value.
Example) Select the same item as the Name field of the displayed record
Settings
You can also format Timeline using the options of Format area. Select the Timeline items to be formatted from the dropdown.
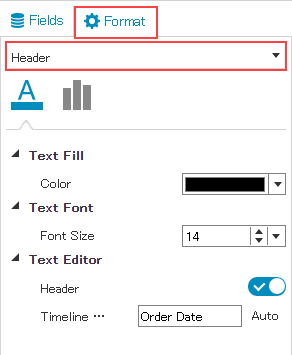
In krewDashboard, you can set following items of the Timeline elements:
| Timeline Elements |
Setting |
Remarks |
| Chart area |
Fill (Color) |
Specify back color of the whole chart |
| Size (Width) |
|
| Size (Height) |
|
| Text Fill (Color) |
Specify font color for the whole timeline |
| Text Font (Font Size) |
Specify font size of the whole timeline |
| Header |
Text Fill (Color) |
Specify the font color of header |
| Text Font (Font Size) |
Specify the font size of header |
| Timeline Caption |
Specify any text |
| Horizontal Alignment |
|
| Selected Time Block |
Fill (Color) |
|
| Unselected Time Block |
Fill (Color) |
|
- Timeline can be used only in the standard edition.
- Only Date and time and Date fields can be used in the Timeline.
See Also