Sparkline is a field type specific to krewSheet. Data is display only and not saved in kintone.
You can create a small graph (sparkline) in a cell, using data in a specific range of cells. Data used for the sparkline is limited to the values in the record.

Setting Sparkline
(1). Drag and place the "sparkline" from the field area to the sheet area.
(2). Right-click the header line of the "sparkline" and select Setting Column.
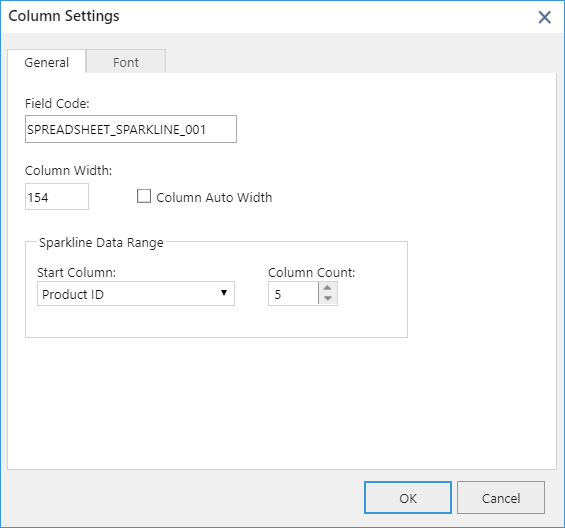
(3). When the following screen is displayed, specify data to use.
(4). The sparkline is displayed as follows.
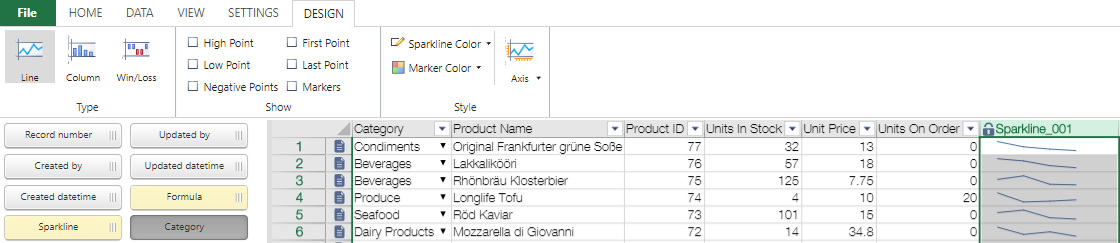
Various Setting Values of Sparkline in Ribbon Area
You can select a sparkline cell to set the marker color, sparkline color, and others.| Name | Description |
|---|---|
| Line | Draws values as a line chart. |
| Column | Draws values as a column chart. |
| Winloss | Displays each point in the same size. Negative points are drawn downward from the axis, and positive points upward. |
| Peak (max) | Displays the maximum value if checked. |
| Peak (min) | Displays the minimum value if checked. |
| Negative points | Displays negative value points if checked. |
| Start point | Displays the first drawn point in the chart if checked. |
| End point | Displays the last drawn point in the chart if checked. |
| Markers | Displays all the values (peak (max), peak (min), negative, start, and end points) if checked. |
| Sparkline color | Sets the sparkline color. |
| Marker color | Different colors can be set for the negative points, markers, peak (max), peak (min), start point, and end point. |
| Axis | Display/hides the axis and customizes the axis setting. See Axis Options below for details. |
・Sparkline is a field specific to krewSheet. When the record is saved, the "sparkline" field is not saved on the server side.
・The sparkline is always created and displayed by referencing the values in the specified data range. The sparkline cannot be edited directly at runtime. When you want to modify it, you need to edit the source data.
・The sparkline cannot be sorted.
Axis Options
Depending on data, the chart displayed by the sparkline can be made easier to read by changing the axis.
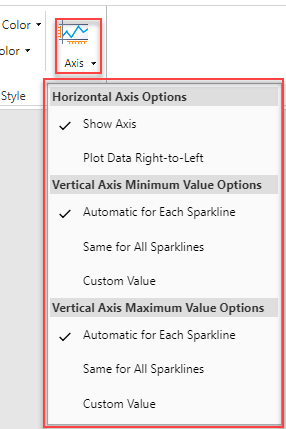
Horizontal Axis Options
| Name | Description |
|---|---|
| Display Axis | If checked, the horizontal line is displayed on the sparkline at 0. ・When the axis is displayed:  ・When the axis is not displayed:  |
| Plot Data Right to Left | If checked, the horizontal axis is reversed. |
Minimum Value Options of Vertical Axis/Maximum Value Options of Vertical Axis
| Name | Description |
|---|---|
| Automatically Set per Sparkline |
Uses the minimum and maximum values for each sparkline. |
| Same Value for All Sparklines |
Shares the minimum and maximum values among all sparklines. Since values on the vertical line have the same scale for all sparklines, it helps users to understand the data trend rather than the magnitude of value. |
| User Setting Values | Sets numbers for the minimum and maximum values on the vertical line of the sparkline. |