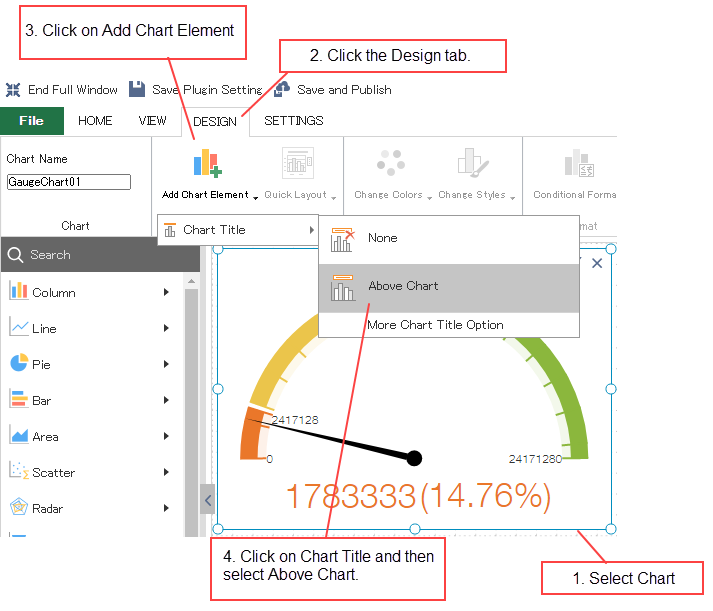
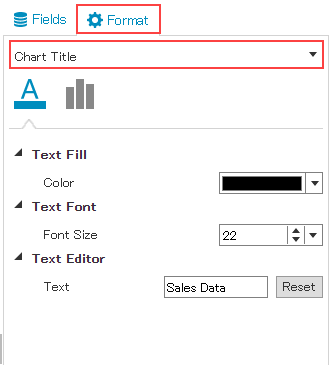
You can display a chart title to make it easy to understand the chart content. Follow the steps shown in the image below to add a chart title. To hide the chart title, select None from the Chart Title.
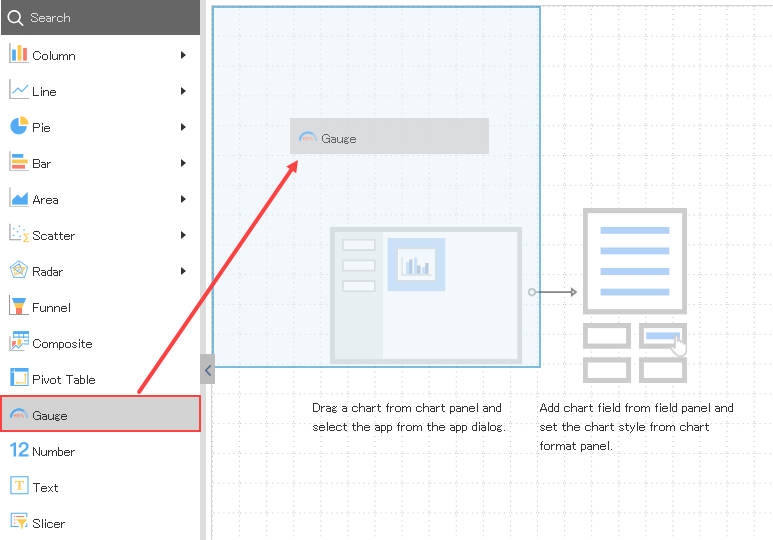
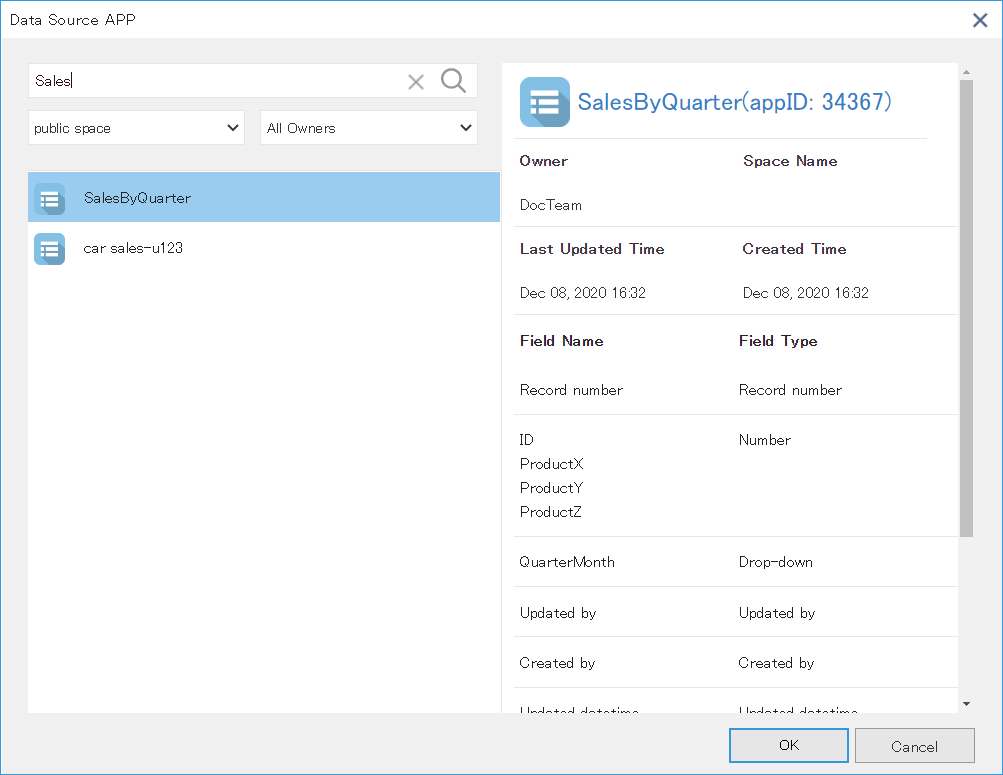
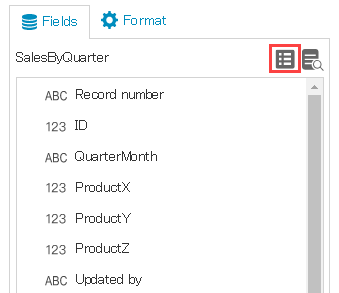
This topic discusses the steps to create a chart.
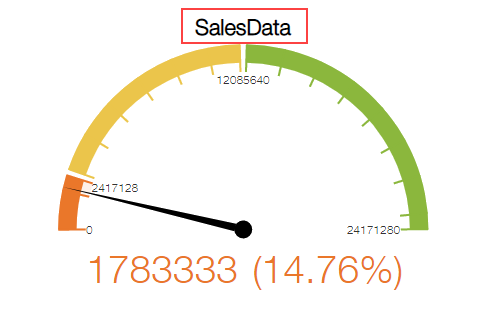
You can also set various elements of the chart. Below section discusses the chart elements and how to set them on chart.
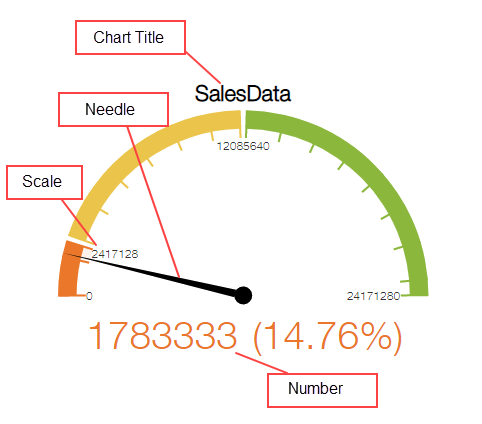
You can display a chart title to make it easy to understand the chart content. Follow the steps shown in the image below to add a chart title. To hide the chart title, select None from the Chart Title.
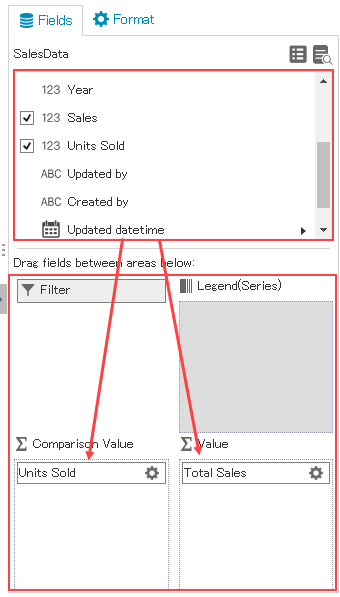
The two aggregated values are compared and used to track performance. Once the chart is selected, you can format it in the Format area.
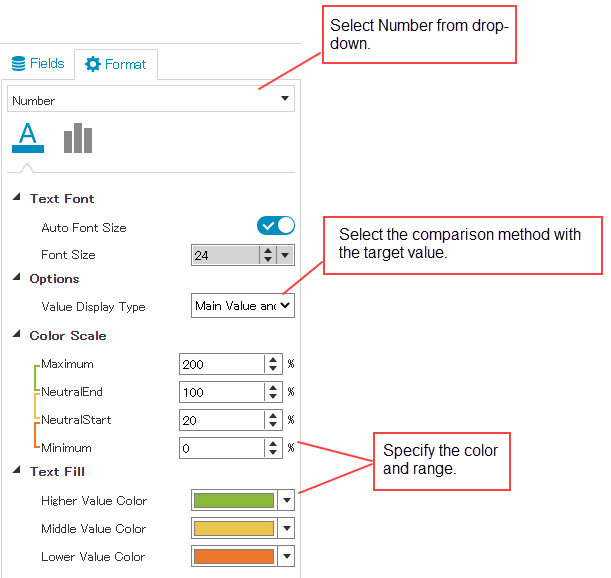
Select one of the following comparison methods:
| Comparison method | Description |
|---|---|
| Main Value | Displays the value. |
| Delta Value | Displays the difference between comparison value and value (Comparison value - Value). |
| Percentage of target | Displays the percentage of value against comparison value (Value/Comparison value). |
| Percentage from target | Displays the percentage of difference between value and comparison value against comparison value ((Comparison value - Value)/Comparison value) |
| Main value and percentage of target | Displays the value and percentage of value against comparison value (Value/Comparison value). |
| Delta value and percentage from target | Displays the difference between comparison value and value (Comparison value - Value) and the percentage of difference between value and comparison value against comparison value ((Comparison value - Value)/Comparison value). |
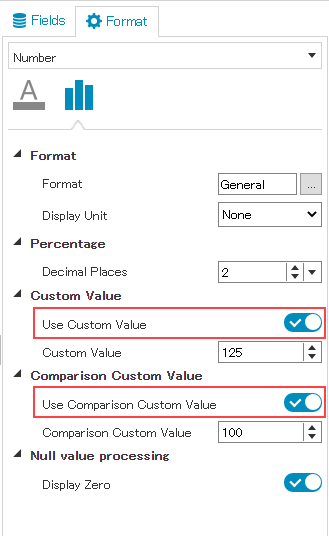
By checking On the Use Custom Value and Use Comparison Custom Value, you can set any fixed value instead of aggregates.
You can set chart formatting in the Format area. Select chart element to be formatted from the dropdown.
krewDashboard provides following settings to format the chart elements.
| Chart Element | Setting | Remarks |
|---|---|---|
| Chart Area | Fill | Set back color of the whole chart, only available in gauge chart |
| Width | ||
| Height | ||
| Text Fill (Color) | Set font color for the whole chart, only available in gauge chart | |
| Text Font (Font Size) | Set font size for the whole chart, only available in gauge chart | |
| Chart Title | Display/Hide the chart title | Set using Add Chart Element of ribbon menu |
| Text Fill (Use Value Color) | Specify whether to use same color as value | |
| Text Fill (Color) | ||
| Text Font (Font Size) | ||
| Text Editor (Text) | Specify any text | |
| Horizontal Alignment | ||
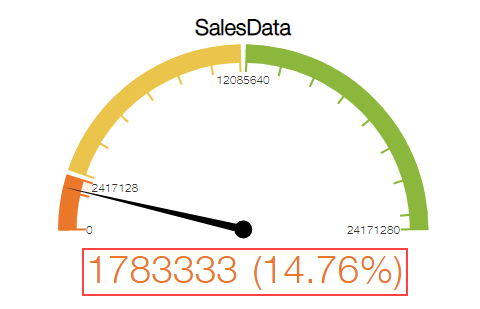
| Number | Auto Font Size | Specify whether to automatically adjust the font size according to the chart size |
| Font Size | Specify a fixed value of font size | |
| Value Display Type | Specify how to compare value and comparison value | |
| Text Size (Font Size) | ||
| Color Scale | Select from Maximum/NeutralEnd/Neutral Start/Minimum | |
| Text Fill | ||
| Back Color | Only available in number chart | |
| Format | ||
| Display Unit | ||
| Decimal Places | Specify number of decimal places for percentage | |
| Use Custom Value | ||
| Custom Value | ||
| Use Comparison Custom Value | ||
| Comparison Custom Value | ||
| Display Zero | Specify whether to display zero when there is no data for aggregated values | |
| Gauge Scale | Text Fill (Color) | Only available in gauge chart |
| Text Font (Font Size) | Only available in gauge chart | |
| Gauge Pointer | Fill (Color) | Only available in gauge chart |